Fast Facts
Enrollment (Fall 2023)
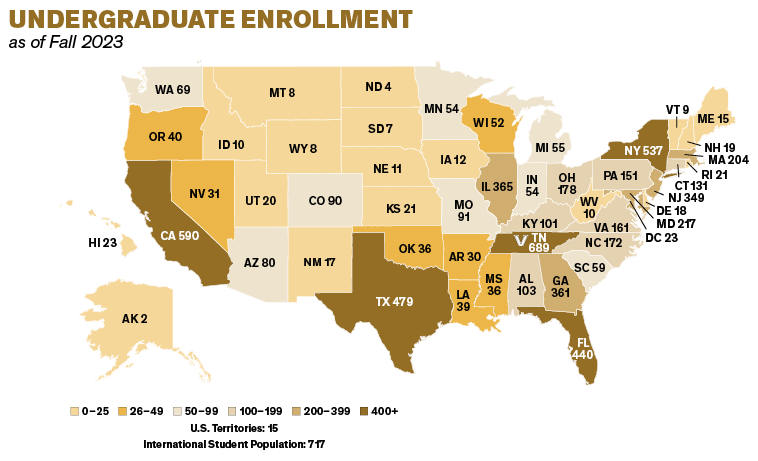
Undergraduate 7,152
Graduate and professional 6,304
Total 13,456
All Undergraduate (Fall 2023)
Female 52%
Male 48%
First-Year Students Entering Fall 2023
American Indian/Alaska Native 0.5%
Asian American 18.7%
Black/African American 11.5%
Hawaiian/Pacific Islander 0.3%
Hispanic or Latino 12.9%
International 10.7%
Multiracial (non-Hispanic) 6.2%
Not reported 3.0%
White 36.3%
ACT Middle 50% 34–35
SAT Evidence-Based Reading and Writing
Middle 50% 740–770
SAT Mathematics Middle 50% 770–790
National Merit Scholars 169
Academics
Undergraduate colleges & schools 4
Student-to-faculty ratio 7:1
Classes with fewer than 50 students 91%
Female faculty 44%
Minority faculty 21%
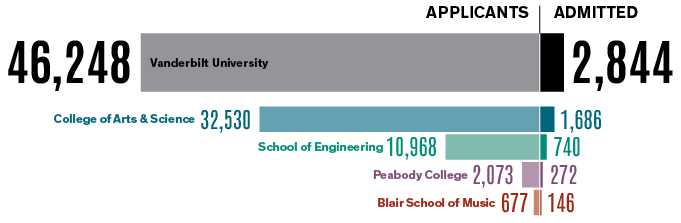
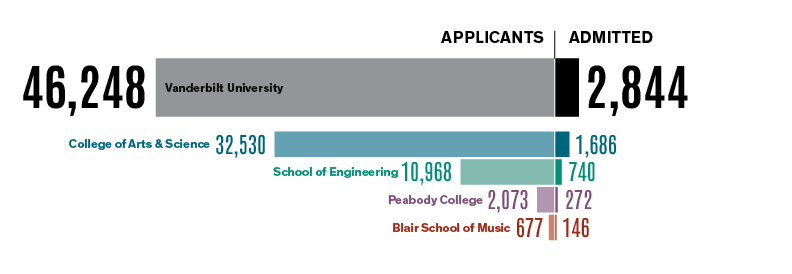
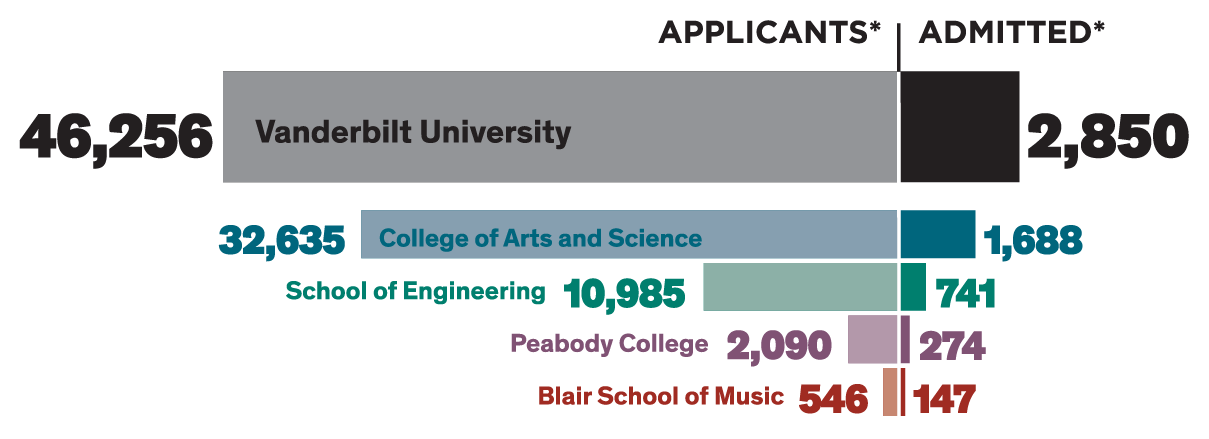
Undergraduate Admission (Fall 2023)
First-year applicants 46,248
Admits 2,844
Admit rate 6.1%
Campus Life
Student organizations 475+
Commodore Athletics
Varsity teams 11 women’s, 6 men’s
NCAA championships 6
Club sports 32
Intramural sports leagues 40+
Financial Aid & Scholarships 2023–24
Undergraduates receiving some form of financial assistance 65%
Average financial aid package $71,283
First-Year Student Retention Rate 96%
Students Graduating in 6 Years 93%